
System visibility — what each run costs and does
Itervox already knows every agent run’s process group: it starts each agent turn and each hook in its own group (and, on Windows, its own Job Object). System visibility watches those groups and answers three questions without opening a terminal:
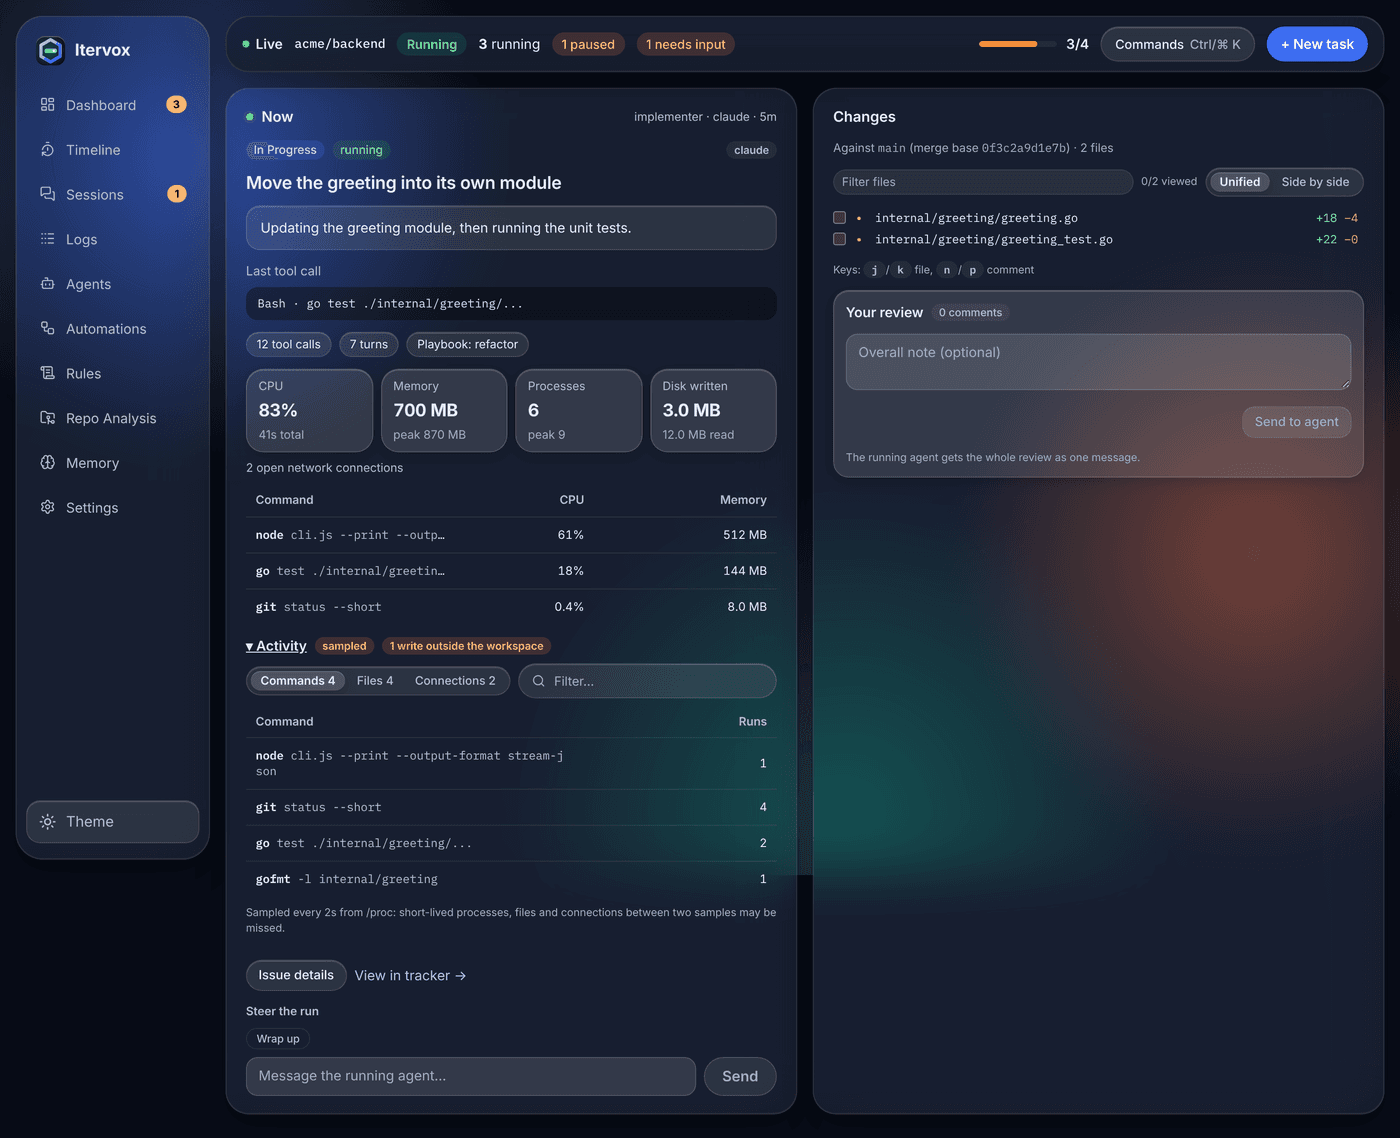
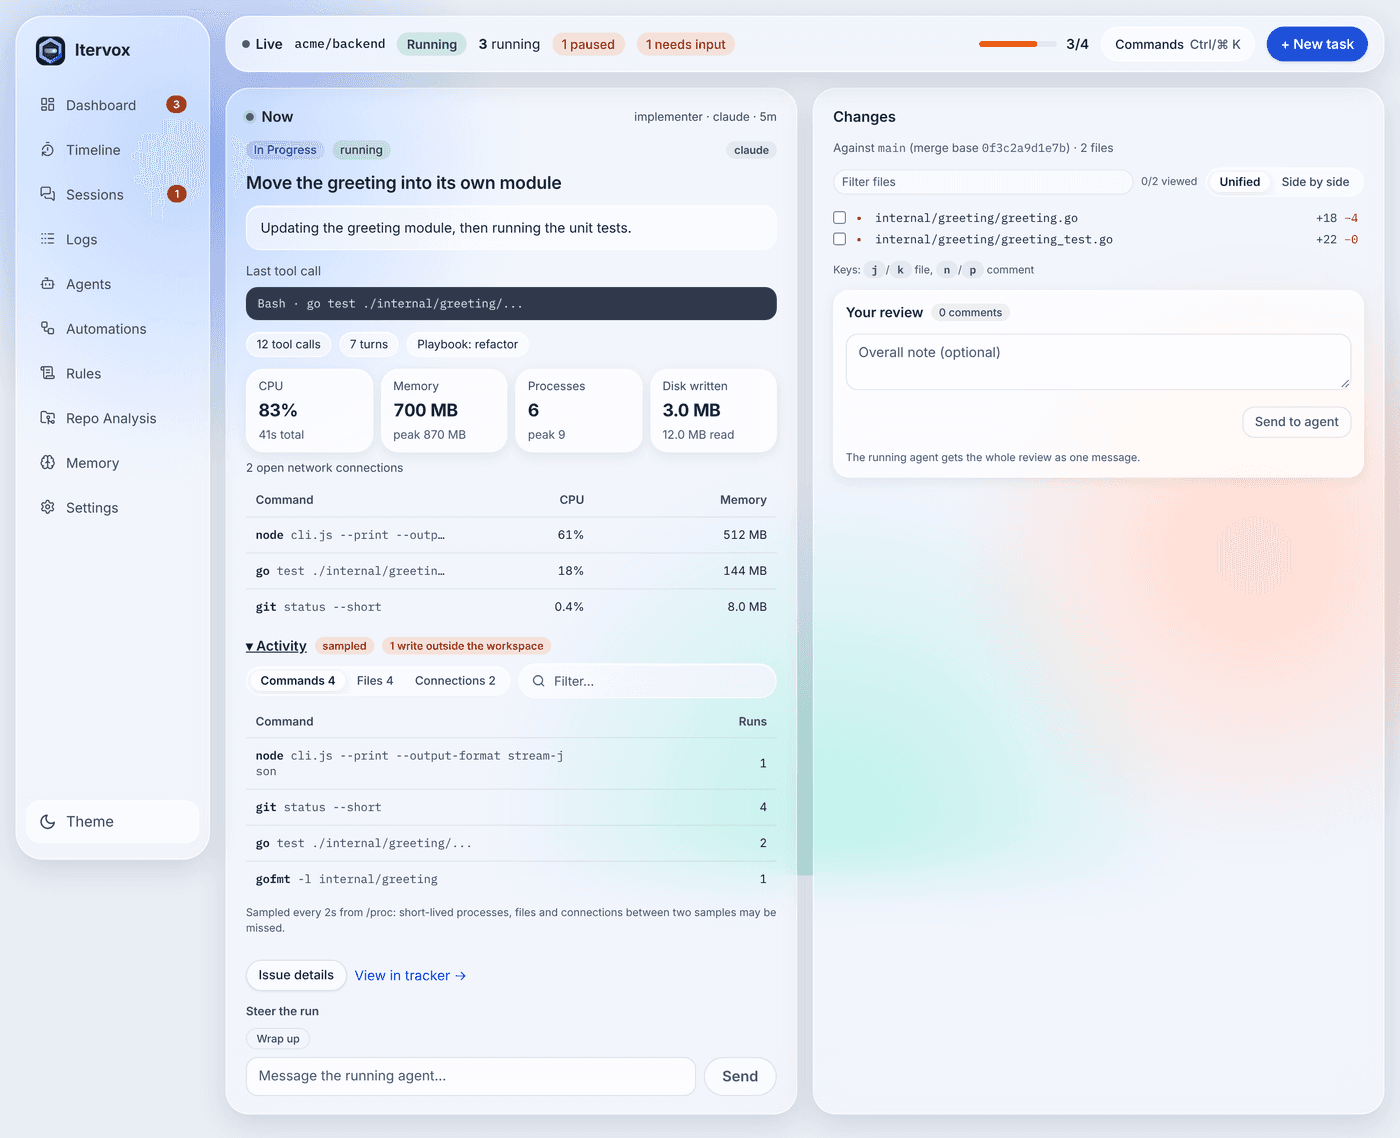
- What is this run costing the machine? CPU, memory, process count, disk I/O and open network connections, with the busiest child commands.
- What did this run do? The commands it started, the files it wrote or had open, and the network connections it made.
- Is the machine all right? Load, memory pressure and free disk on the volume that holds the workspaces, with a warning (and optionally a dispatch pause) when the disk runs low.
Everything is on by default. Nothing here leaves the machine except through the daemon’s own API.
Per-run resources
Section titled “Per-run resources”Each local run is sampled at most every 2 seconds by one sampler goroutine in the daemon (never on the orchestrator’s event loop). A sample covers the run’s whole process tree: the members of its process groups, their leaders, and every descendant — including a child that started its own session.
| Figure | Meaning |
|---|---|
| CPU | Percent of one core over the last interval, summed over the tree (200% = two busy cores). The total CPU time is kept too. |
| Memory | Resident memory (RSS) summed over the tree, with the run’s peak. Pages shared between processes count once per process. |
| Processes | Live processes in the tree, with the peak. |
| Disk written / read | Storage I/O of the tree since the run started (Linux and Windows; macOS does not report it per process). |
| Connections | Open TCP/UDP connections of the tree (listening sockets are not counted). |
| Top child commands | The five busiest processes: name, arguments, CPU and memory. |
Where you see it:
- the issue’s Now panel (issue detail and the issue view) while the run is live, and its last sample after it finishes;
resourcesonGET /api/v1/issues/{identifier}/contextand on eachrunning[]row ofGET /api/v1/state;resourceson each run-history row: CPU time, peak CPU, last and peak memory, peak process count, disk I/O and activity counts, kept with the history file;- Prometheus gauges
itervox_run_cpu_percent,itervox_run_memory_rss_bytesanditervox_run_processes(labelled by issue identifier, live runs only); - the desktop tray: each project’s line reads, for example,
running · 3 agents · 1.2 GB.
Totals are monotonic: a process that exits keeps the CPU time and I/O it was last seen with. Work a process does between its last sample and its exit is not counted.
An SSH worker runs its agent on another host: only the local ssh
client is visible, and the panel says so.
Command lines are redacted before they are kept or served: the log
redaction (known key shapes, bearer tokens, high-entropy strings), plus the
values of NAME=value assignments, of flags named like credentials
(--token=…, --password …, --api-key …) and URL credentials. A viewer
token sees each child command’s name only; arguments need an operator
token.
Turn sampling off with agent.resource_sampling: false.
Activity audit
Section titled “Activity audit”The Activity section of the Now panel (collapsed until you open it) lists, for the issue’s latest run or a run you pick:
- Commands started by the run, each distinct command line once with a count;
- Files it wrote (and, in sampled mode, other files it had open), with outside marked on a write outside the run’s workspace and a warning chip counting them;
- Connections: the remote address, protocol, state and the command that made it.
A filter narrows the lists. The audit is served by
GET /api/v1/issues/{identifier}/activity?run=<runId>, an operator
route: command lines, paths and remote addresses say a lot about your code
and machine even after redaction. A viewer sees a note instead.
Modes and platforms
Section titled “Modes and platforms”agent.activity_audit chooses how activity is recorded.
| Mode | Linux | macOS | Windows |
|---|---|---|---|
sampled (default) | Commands, files (open files from /proc/<pid>/fd, write or read from fdinfo), connections (sockets matched to /proc/net/tcp, tcp6, udp, udp6 of the run’s network namespace) | Commands, connections. No files: reading another process’s file activity needs Apple’s Endpoint Security entitlement. | Commands, connections. No files. |
precise | Every exec, every openat for writing (O_WRONLY, O_RDWR, O_CREAT, O_TRUNC) and every connect of the run’s process tree, from eBPF tracepoints | falls back to sampled | falls back to sampled |
off | nothing is recorded |
The badge next to Activity names the mode. sampled means what it
says: anything that starts and ends between two samples, 2 seconds apart,
can be missed — a quick curl, a file written and closed at once. Use
precise on Linux when you need every event.
Precise mode (Linux)
Section titled “Precise mode (Linux)”Precise mode loads a small eBPF program (assembled in the daemon; no
compiler or kernel headers are needed) on the sched_process_exec,
sched_process_fork, sched_process_exit, sys_enter_openat and
sys_enter_connect tracepoints. A run’s group leaders are added to a
kernel map as they start and the kernel adds every process they fork, so
only the runs’ own process trees produce events. Field offsets are read
from tracefs at start, so the program follows the running kernel’s layout.
It needs:
CAP_BPFandCAP_PERFMON(kernel 5.8+), or root — for examplesudo setcap cap_bpf,cap_perfmon+ep "$(command -v itervox)";- tracefs mounted at
/sys/kernel/tracing(or/sys/kernel/debug/tracing); - a kernel with BPF ring buffers (5.8+) and syscall tracepoints
(
CONFIG_FTRACE_SYSCALLS).
When any of that is missing the daemon logs the reason and samples instead;
the Activity notes and system.activityModeReason on /api/v1/state say
why, for example precise mode unavailable: tracefs is not mounted at /sys/kernel/tracing. Precise mode lists files the run wrote, not files it
only read. A relative path is resolved against the process’s working
directory when it is still alive.
macOS sandbox denials
Section titled “macOS sandbox denials”Runs under process isolation use sandbox-exec on
macOS. Its deny events go to the unified system log, which the daemon does
not read yet, so they are not part of the activity audit.
Storage and limits
Section titled “Storage and limits”Activity is runtime state under .itervox/runtime/activity/ (gitignored):
one JSON file per run and an index. Per run at most 500 distinct commands,
1000 files and 300 connections are kept (further distinct entries are
counted as dropped and the panel says how many); the directory keeps the
200 newest runs and at most 64 MiB, dropping the oldest first. A live run’s
file is rewritten at most every 15 seconds while it changes, and once when
the run ends.
Machine status
Section titled “Machine status”The daemon also reads, every 10 seconds:
- the load averages (none on Windows) and CPU count;
- memory: total and available, and a pressure level —
ok,moderateorhigh— from Linux PSI (/proc/pressure/memory, share of time tasks stalled on memory) where available, else from the share still available; - the free space on the volume that holds
workspace.root.
They are the system block of GET /api/v1/state (with the live runs’
totals and the activity mode), Prometheus gauges (itervox_host_load1,
itervox_host_memory_total_bytes, itervox_host_memory_available_bytes,
itervox_workspace_disk_free_bytes, itervox_workspace_disk_low) and a
rounded system block on GET /api/v1/summary for the desktop tray.
Low disk
Section titled “Low disk”workspace: disk_warn_free_gb: 5 # default; 0 = no warning disk_pause_free_gb: 2 # default 0 = never pauseBelow disk_warn_free_gb the dashboard shows a warning banner and the
desktop tray a line under its header (⚠ web-app: low disk — 3.2 GB free). Below disk_pause_free_gb the daemon also pauses all dispatch with
the regular dispatch pause (reason Low disk space: …), so running agents finish and nothing new starts; it resumes on
its own once free space is back above the threshold plus 0.5 GB. It only
ever resumes its own pause: a pause you set by hand stays.
Settings
Section titled “Settings”| Key | Default | |
|---|---|---|
agent.resource_sampling | true | Per-run resource sampling. |
agent.activity_audit | sampled | off, sampled or precise. |
workspace.disk_warn_free_gb | 5 | Low-disk warning threshold. |
workspace.disk_pause_free_gb | 0 | Pause dispatch below this. |
All four are read at startup and can live in a settings file; see the configuration reference.